Cite report
IEA (2024), World Energy Outlook 2024, IEA, Paris https://www.iea.org/reports/world-energy-outlook-2024, Licence: CC BY 4.0 (report); CC BY NC SA 4.0 (Annex A)
Report options
Context and scenario design
Setting the scene
- Total global energy demand rose by around 2% in 2023, with declines in advanced economies more than offset by large increases in emerging market and developing economies. A record high level of clean energy came online globally, including more than 560 gigawatts (GW) of new renewable power capacity. Around USD 2 trillion is expected to be invested in clean energy in 2024, almost double the amount invested in fossil fuels. However, two-thirds of the overall increase in energy demand in 2023 was met by fossil fuels and energy-related carbon dioxide (CO2) emissions reached a record high.
- Governments cumulatively earmarked USD 2 trillion of financial support for clean energy between 2020 and mid-2024. They also spent around USD 940 billion on support for consumer energy affordability during the global energy crisis, though most of the measures put in place to provide that support have now expired.
- Many new energy policies, spending plans and regulations have been introduced or announced since the Outlook in 2023. Countries are now putting more emphasis on building domestic clean technology manufacturing capacity to improve energy security and boost economic activity, including through tying support to domestic production or jobs and through trade measures. Since 2020, nearly 200 trade measures affecting clean energy technologies have been introduced.
- This Outlook examines three main long-term scenarios – none of which are forecasts – to provide a framework for understanding possible energy futures. Policies are the critical differentiator between them. We also explore a number of sensitivity cases related to uncertainties in the pace of clean energy deployment, natural gas markets and electricity demand, and the wider implications these have for energy and emissions. Russia’s invasion of Ukraine, conflict in the Middle East, broader geopolitical tensions, and elections in countries accounting for half of global energy demand today mean a very high level of uncertainty over the projections in this Outlook.
- In this Outlook, the global economy increases by 2.7% on average each year to 2050. We maintain a constant economic growth rate across all scenarios to facilitate a comparison of the impacts of energy and climate choices with a consistent backdrop. The global population expands from 8 billion today to 9.7 billion in 2050, an annual average growth rate that is around half the rate seen between 1990 and 2023.
- Prices for fossil fuels and critical minerals have fallen from the very high levels in 2022. Future price changes are assumed to follow smooth trajectories in all scenarios, but there remains an ever-present risk of volatility.
Share of world energy demand voting in elections
National and regional elections in countries that account for half of global energy demand are taking place in 2024.
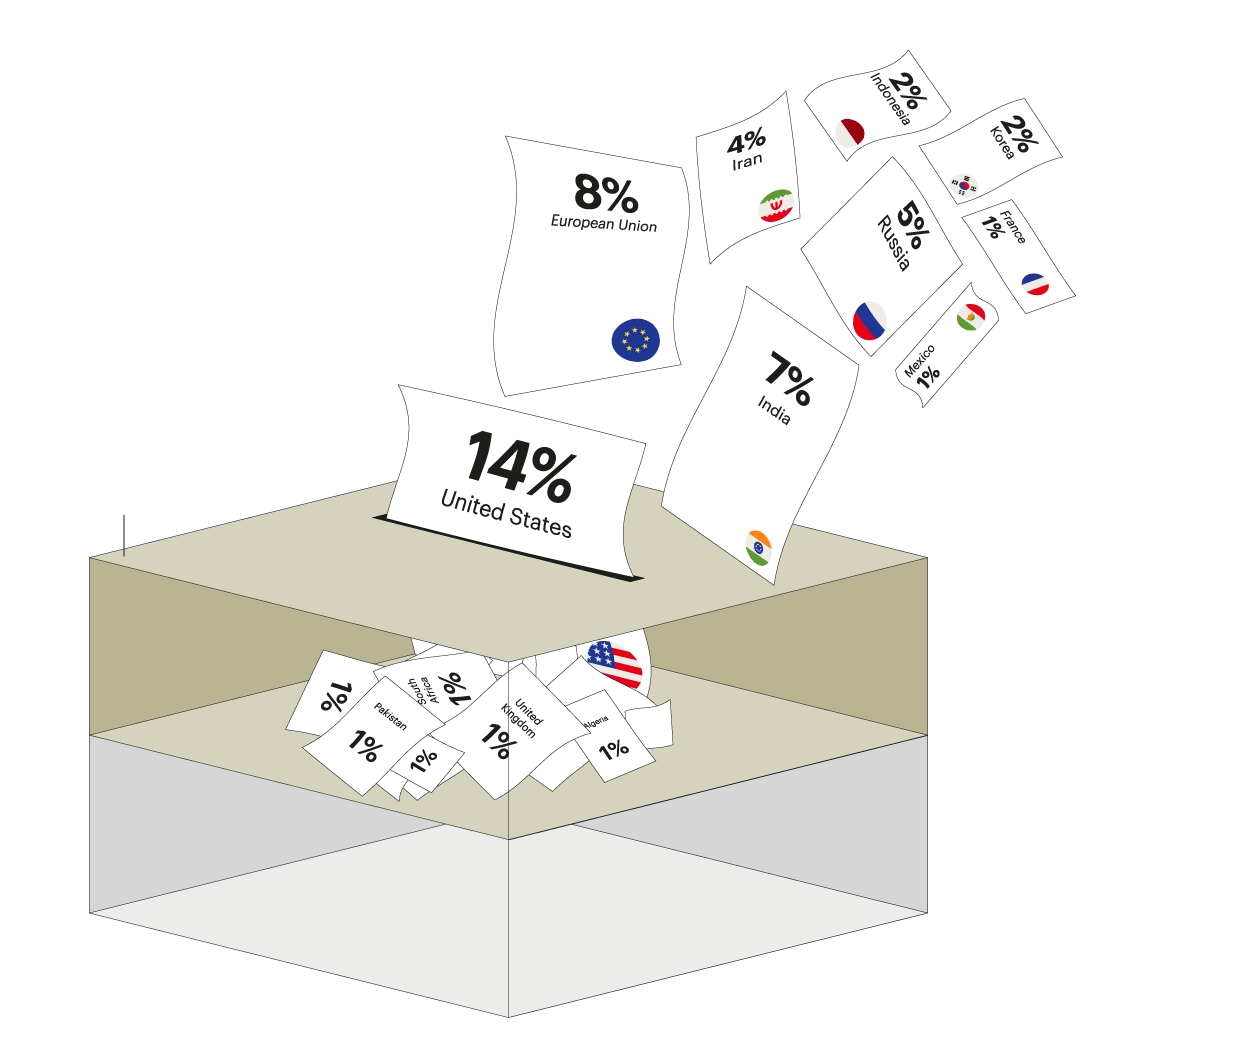
80+ countries
World
energy demand
100%
National and regional
election 2024
50%
No election
0%
Falling clean energy prices
Recent years have seen large overall price reductions for many clean energy technologies.

Million USD per MW
0.74
0.18
2015
2023

Million USD per MW
1.03
0.8
2015
2023

Million USD per MW
1.57
1.02
2015
2023

USD per kWh
398h
139
2015
2023
Global energy demand
A record high level of clean energy came online globally in 2023, but two-thirds of the overall increase in energy demand was still met by fossil fuels.

Annual change 2022-23
+3.6
642 EJ
Traditional use of biomass
Other
EJ
Renewables
+0.9
500
+0.7
Nuclear
Natural gas
Fossil fuels 67%
+4.9
Oil
Coal
0
+3.1 EJ
2010
2015
2020
2022
2023

Annual change 2022-23
+3.6
642 EJ
Other
Traditional use of biomass
Renewables
+0.9
EJ
500
+0.7
Nuclear
Natural gas
Fossil fuels 67%
+4.9
Oil
Coal
+3.1 EJ
0
2023
2010
2015
2020
2022